
Databricks cost optimization: where the spend goes, and how to fix it
Pull-quote: “A cost dashboard with no owner and no cluster policy behind it is a receipt, not a control.”
Databricks cost optimization is an attribution problem before it is an efficiency problem. Almost every alarming lakehouse bill is made of findable mechanisms: scheduled jobs on interactive clusters, SQL warehouses that never stop, autoscaling floors nobody revisited since the proof of concept, and a dozen jobs re-reading raw data because the layer meant to clean it once was never built. None of that appears on an invoice, which is why cost pushes start by turning things off and end in a rebound.
This post is for the engineer or platform lead holding a Databricks bill and a mandate to reduce it. It assumes you can write SQL and read Unity Catalog system tables, the Databricks-provided tables that record platform activity. By the end you will have a measurement model, a ranked fix list, and guardrails that stop the spend reappearing next quarter.
What you will be able to do
- Name the mechanisms that grow a lakehouse bill, and recognise each from its symptom rather than from a hunch.
- Query
system.billing.usageandsystem.billing.list_pricesfor a defensible spend figure per job and team. - Design a tagging scheme that holds, given that tags apply at resource creation and cannot be backfilled.
- Work a remediation ladder in return order, starting with configuration changes that need no code review.
- Decide between serverless and classic compute, and whether to enable Photon, on measured tradeoffs.
- Install guardrails: cluster policies, budget alerts, a named owner, and a review cadence.
Why does a lakehouse bill grow faster than the workload?
Because separating compute from storage turns every inefficiency into a rented machine-hour instead of a slower query on hardware you already paid for. On a fixed-size appliance, a badly written job is a queueing problem your colleagues complain about. On a lakehouse it is a line item, and nobody complains, because it completed. Platform defaults compound the effect: a generous auto-termination window and a warehouse that stays warm all afternoon are sensible onboarding choices that quietly become your baseline.
You are also billed in two currencies, which trips up most first analyses. The first is the DBU, or Databricks Unit, a normalised measure of processing capacity billed per hour of use at a rate set by the product (all-purpose compute, jobs compute, SQL, model serving) and your account tier. The second is your cloud provider’s charge for what sits underneath: virtual machines, attached storage, object storage requests, egress. Classic compute bills both, separately. Serverless folds the machine into the DBU rate.
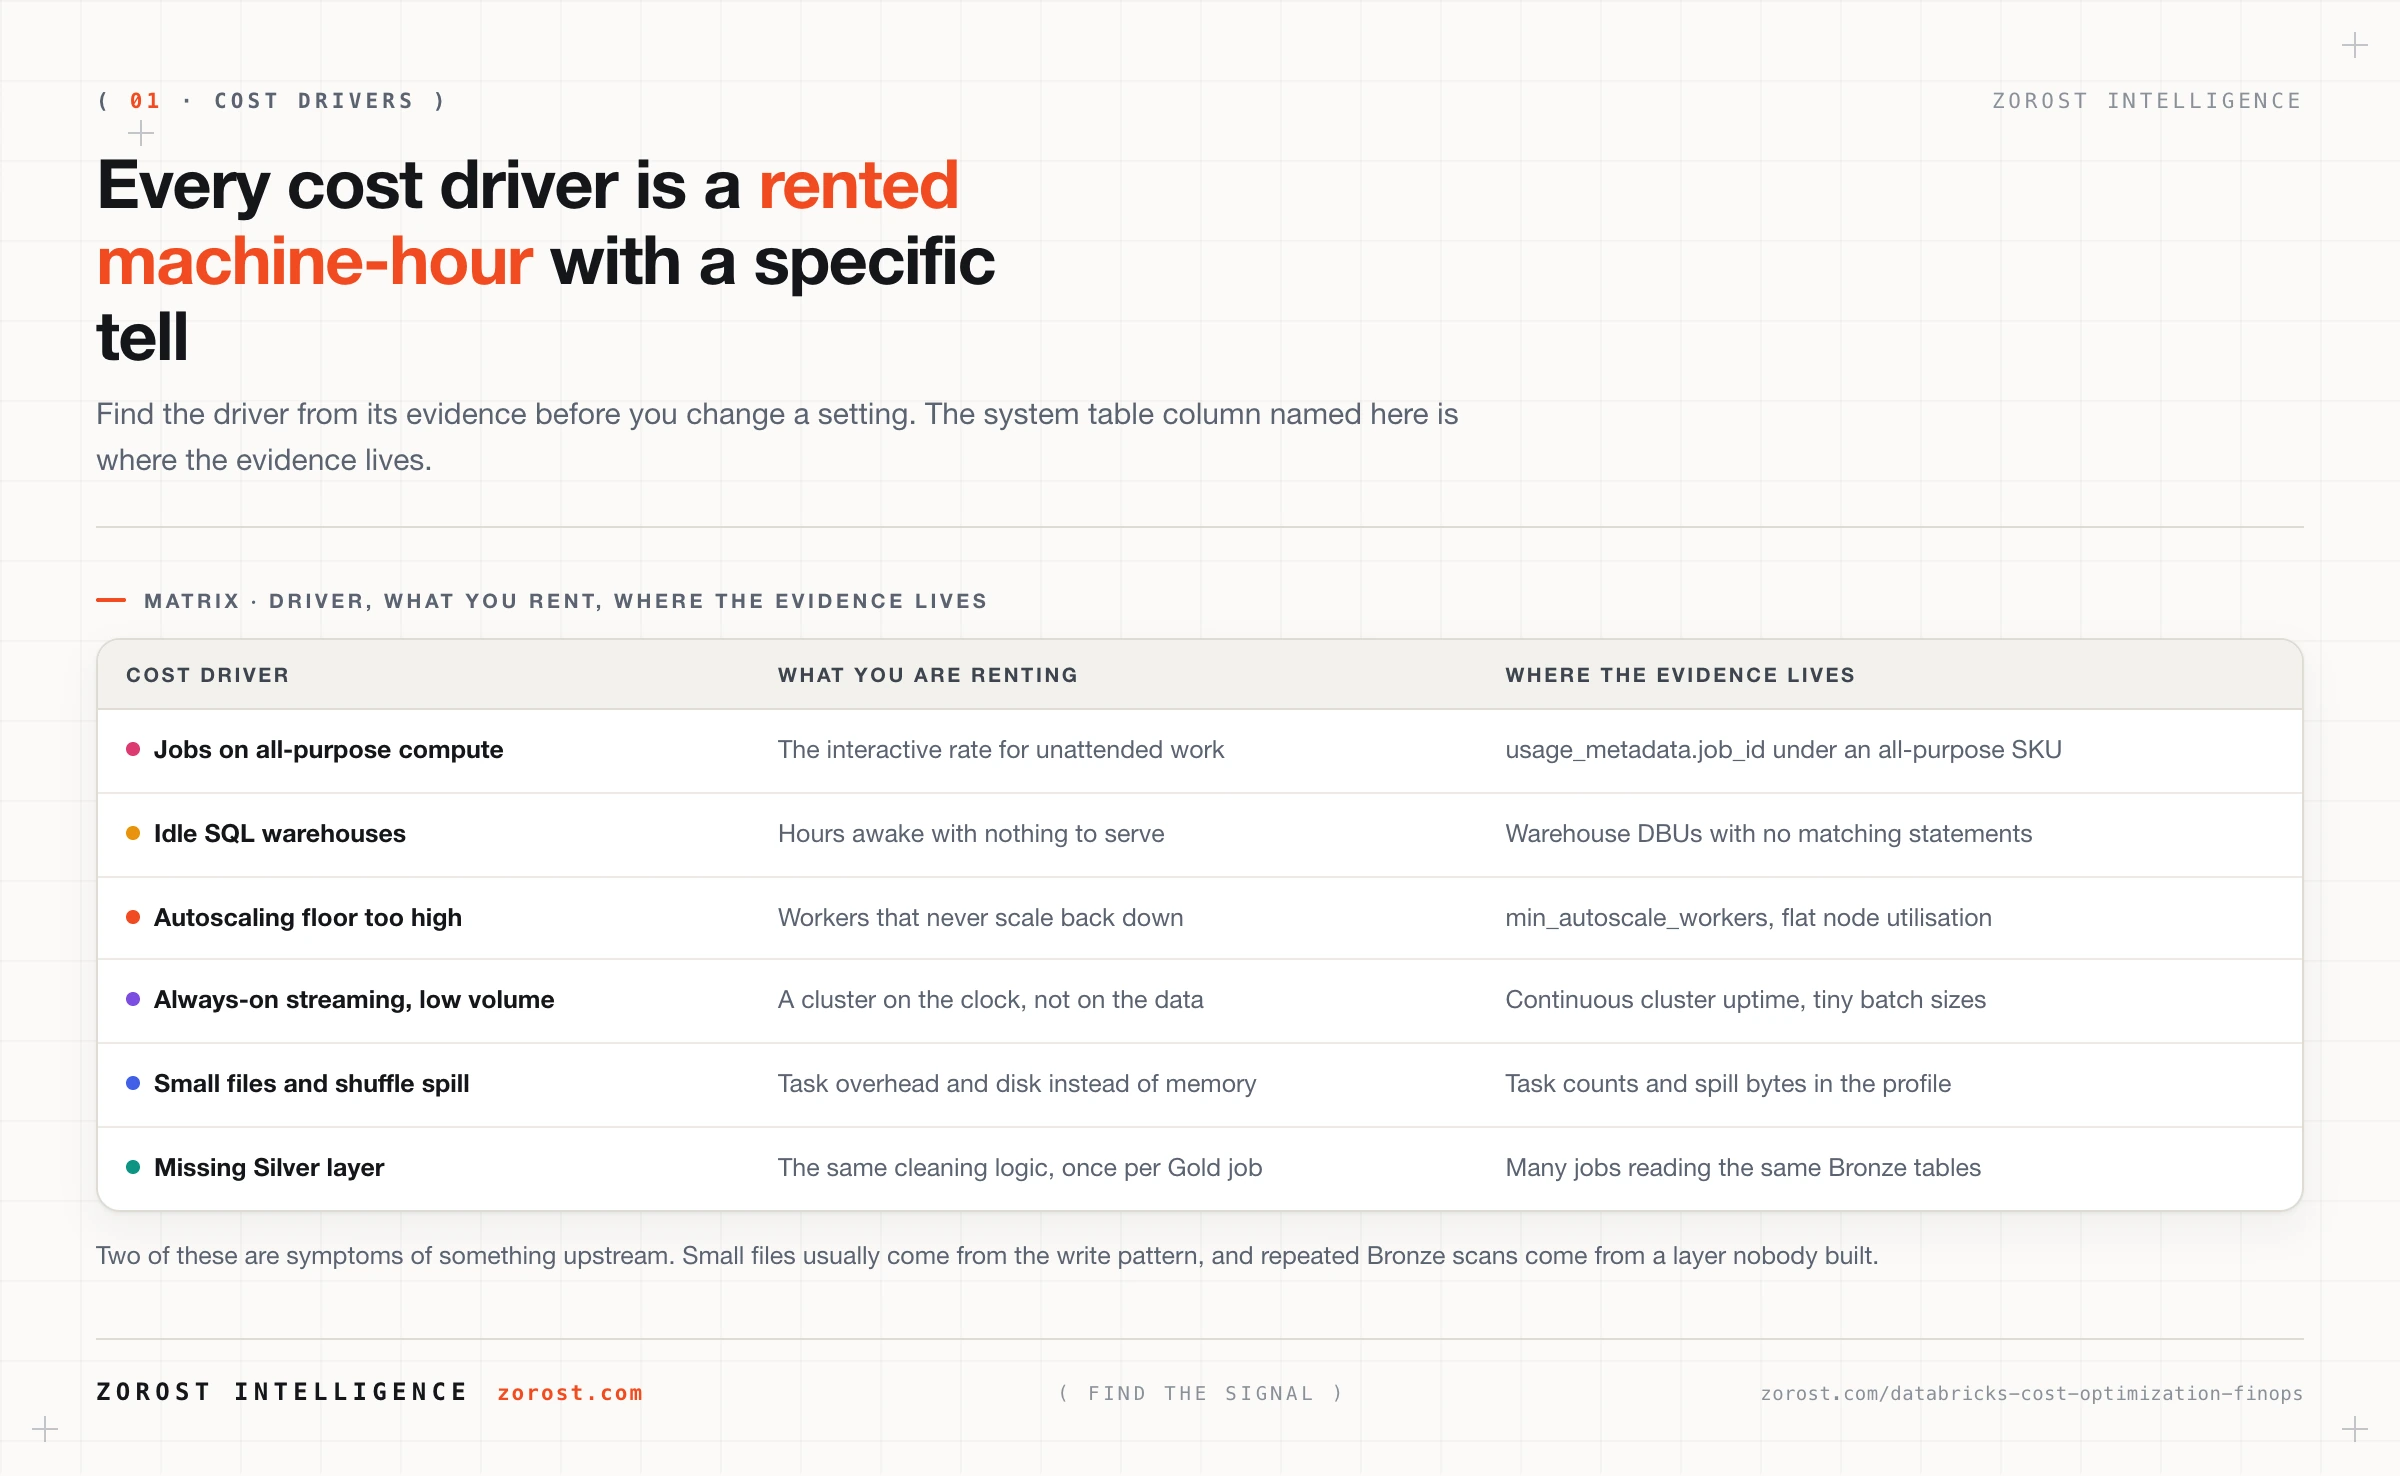
Which cost drivers actually move the bill?
The drivers below are where recoverable money hides, and the fixes range from a settings change this afternoon to a quarter of architecture work.
| Cost driver | Symptom to look for | Fix | Effort |
|---|---|---|---|
| Jobs on all-purpose compute | A job_id appears under an all-purpose SKU |
Move to jobs or serverless compute | Low |
| Idle SQL warehouses | Warehouse DBUs accrue in hours with no statements | Tighten auto-stop, consolidate | Low |
| Autoscaling floor too high | Workers never return to minimum, CPU flat and low | Lower minimum workers only | Low |
| Exploration on production compute | Notebook usage on the cluster running pipelines | Separate compute, short auto-termination | Low |
| Always-on streaming, low volume | A cluster bills 24 hours for a trickle | Trigger with availableNow |
Medium |
| Small files and shuffle spill | Thousands of tasks for small inputs, spill in the profile | Compact, cluster, fix the writer | Medium |
| Missing Silver layer | Many Gold jobs each scanning raw Bronze | Build the conformed layer once | High |
Small files are a symptom more often than a cause: a streaming write with a short trigger interval, or a job partitioned on a high-cardinality column, produces them faster than compaction removes them, so the durable fix sits upstream of OPTIMIZE. The missing Silver layer is the most expensive entry and the hardest to see, because it presents as eight pipelines that are each slightly slow.
Where does Databricks cost optimization actually start?
It starts with attribution. Until every dollar maps to a job, a warehouse, and an owning team, every efficiency change is unmeasurable, and unmeasurable changes get reversed the first time someone’s query feels slow.
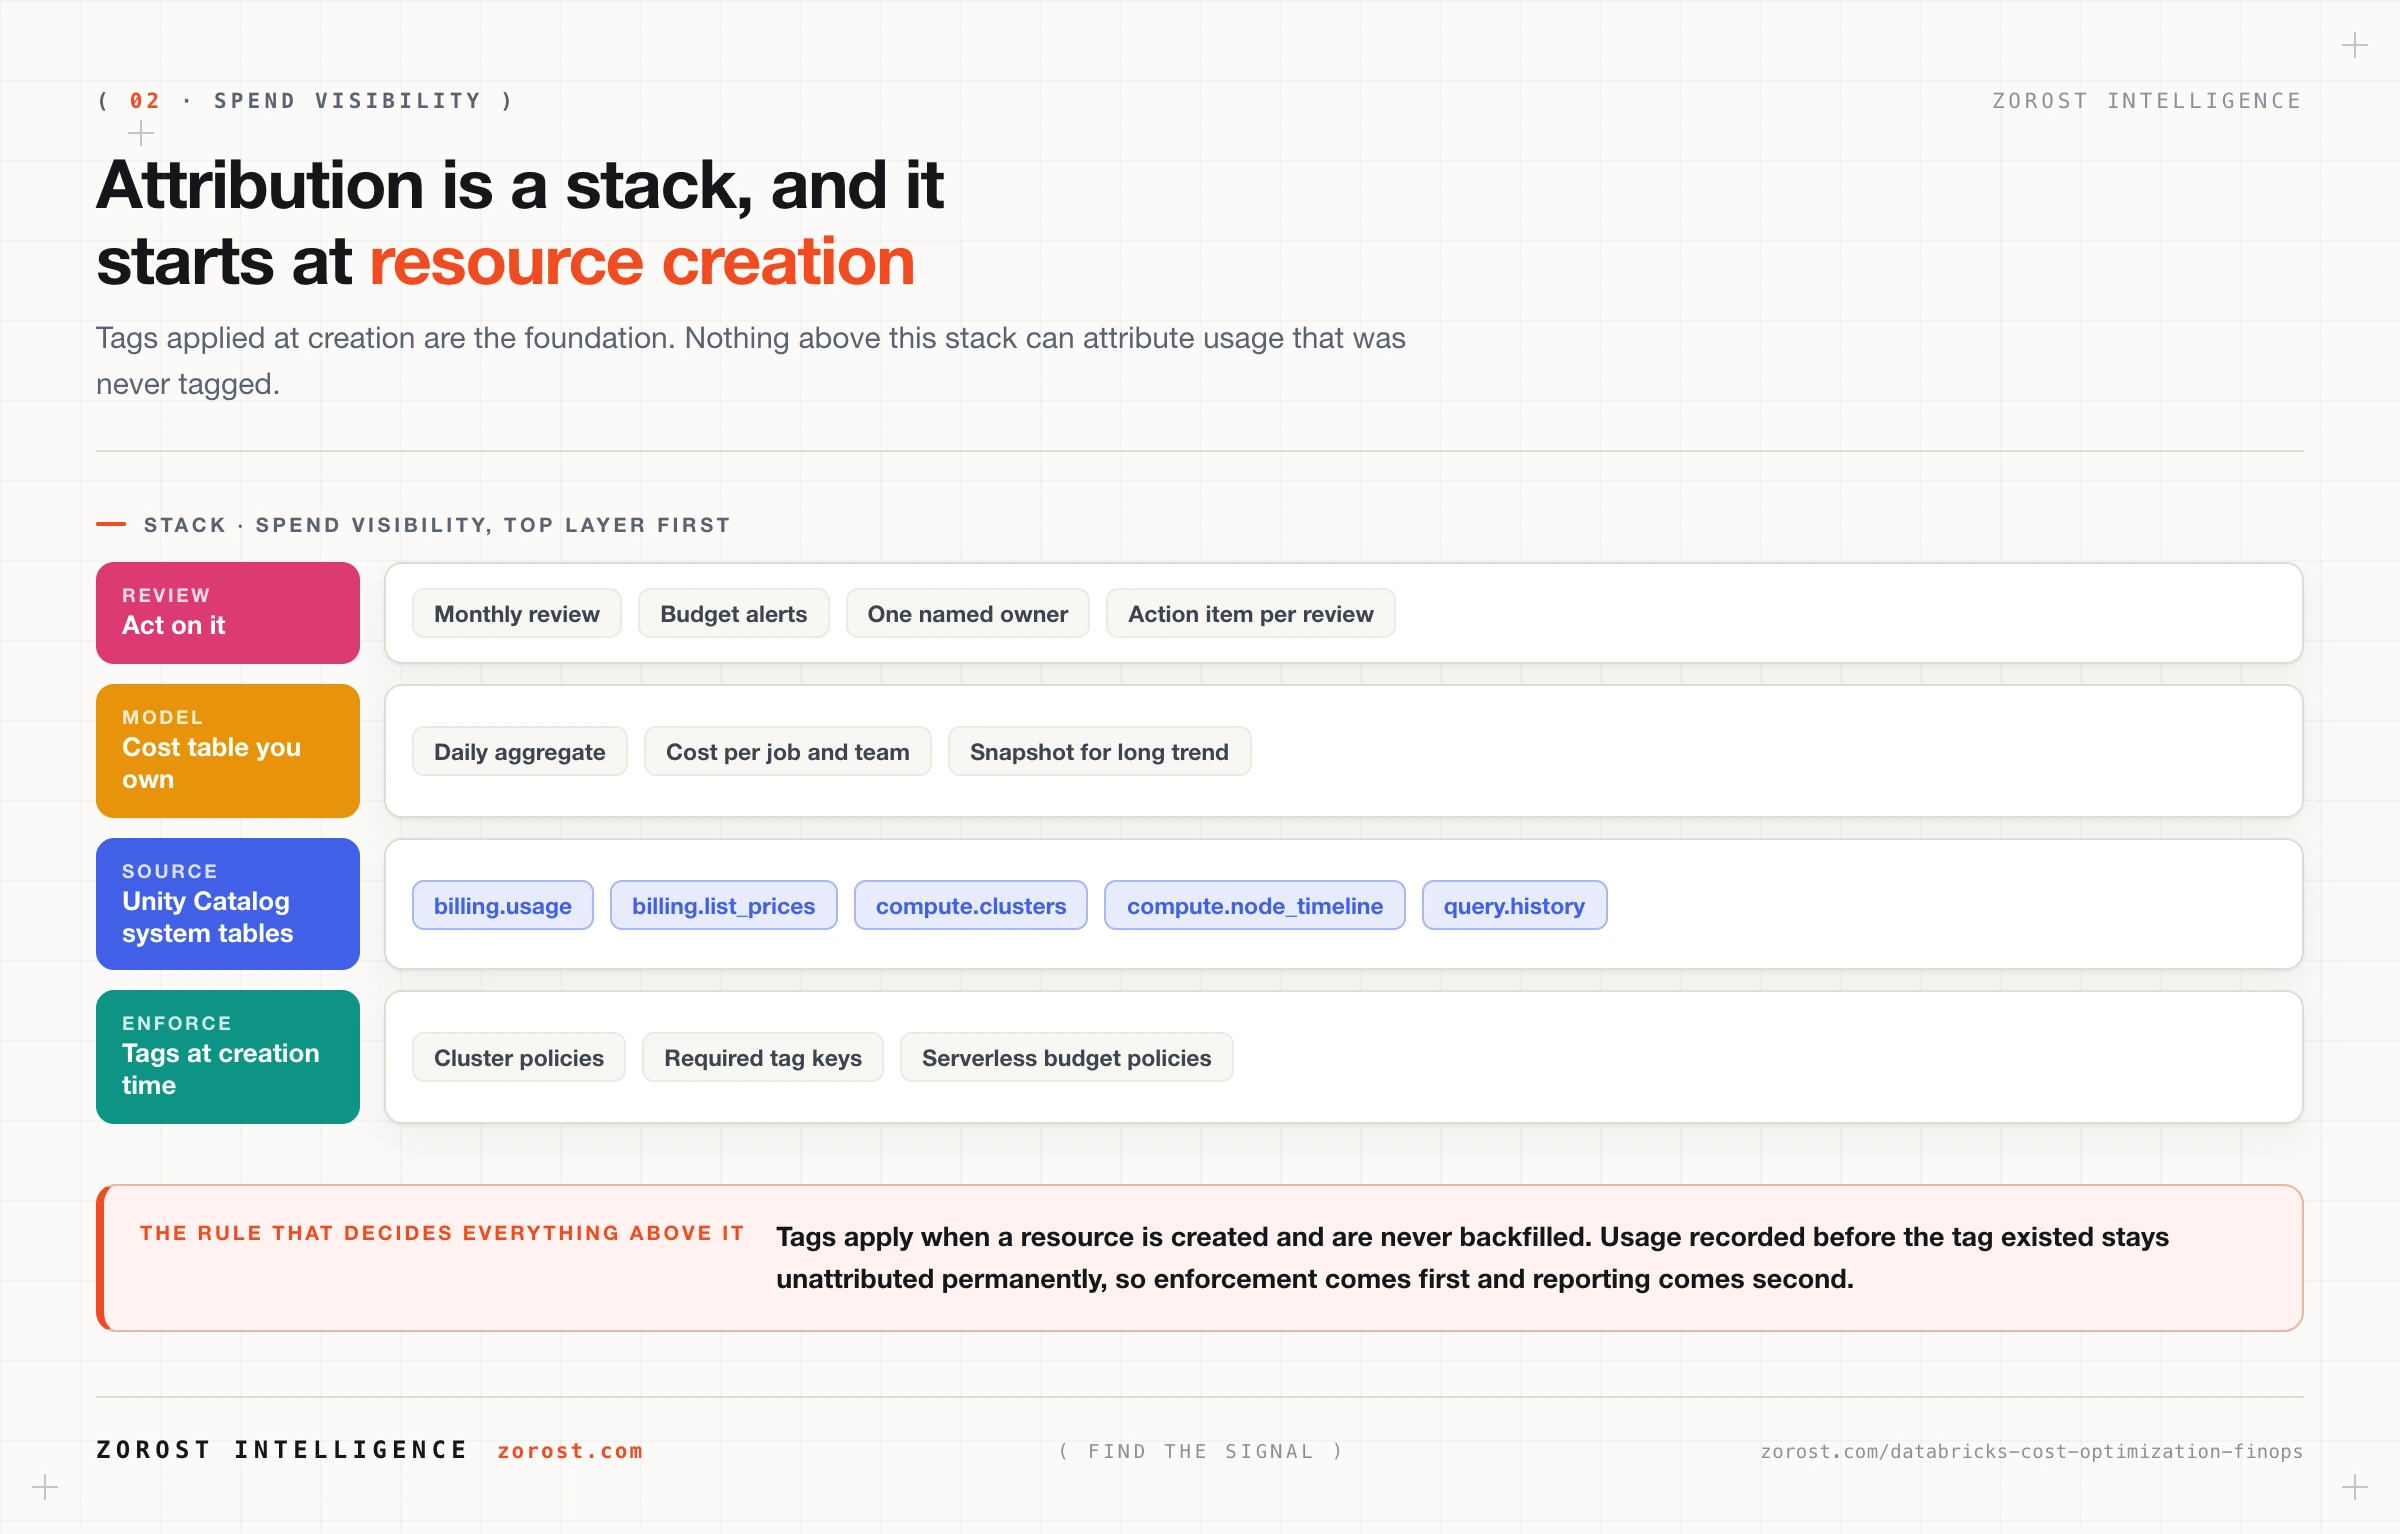
Unity Catalog system tables are the source. Five matter for cost work:
system.billing.usage: one row per hour per SKU per resource, withusage_quantityin DBUs, ausage_metadatastruct naming the responsible cluster, warehouse, job, or pipeline, and acustom_tagsmap.system.billing.list_prices: list price per SKU with validity windows, so DBUs convert to a dollar figure.system.compute.clusters: the cluster specification over time, including auto-termination, autoscaling bounds, node types, and owner.system.compute.node_timeline: per-minute node utilisation, which separates a big cluster from a wasted one.system.query.history: statements with warehouse, user, duration, and bytes read, which exposes the dashboard keeping a warehouse awake.
Two operational facts. Some system table schemas must be enabled by an account admin before they return rows, so run SHOW SCHEMAS IN system and enable what is missing. Records also land with a lag, so reconcile on complete days.
Tagging is the other half, and the half teams get wrong. Three keys carry most of the weight: paying team, workload, environment. Cluster tags flow into the custom_tags map on usage rows and onto the underlying cloud resources, and jobs, warehouses, and pipelines each carry their own. Serverless takes tags through account-level budget policies instead.
The rule that governs the rest: tags apply at creation and are not retroactive. Usage recorded before a tag existed stays untagged permanently, so tag everything first, then wait a full billing period before drawing conclusions. You know it worked when a query grouping thirty days of usage by custom_tags['team'] leaves an untagged bucket that is small and shrinking. A flat bucket means some creation path is bypassing your policy.
How do you turn usage records into a cost number you can defend?
Join usage to list prices on the SKU and the price validity window, then state clearly that the result is list price rather than your invoice.
SELECT
  u.sku_name,
  u.custom_tags['team']                     AS team,
  u.usage_metadata.job_id                   AS job_id,
  SUM(u.usage_quantity)                     AS dbus,
  SUM(u.usage_quantity * p.pricing.default) AS list_cost_usd
FROM system.billing.usage u
JOIN system.billing.list_prices p
  ON  u.cloud    = p.cloud
  AND u.sku_name = p.sku_name
  AND u.usage_end_time >= p.price_start_time
  AND (p.price_end_time IS NULL OR u.usage_end_time < p.price_end_time)
WHERE u.usage_date >= current_date() - INTERVAL 30 DAYS
  AND p.currency_code = 'USD'
GROUP BY ALL
ORDER BY list_cost_usd DESC
LIMIT 50
The time-window join matters: prices change, list_prices is versioned, and joining on sku_name alone multiplies rows and inflates every figure you report.
Publish the caveat with the number. This is list price, so your negotiated rate, commit discounts, and the cloud infrastructure charges behind classic compute are all absent. The model is good for comparison and trend and wrong for invoicing. Reconcile against the account console once, then move on.
The highest-value query on a new estate finds scheduled work running on interactive compute:
SELECT usage_metadata.job_id, usage_metadata.cluster_id, sku_name,
       SUM(usage_quantity) AS dbus
FROM system.billing.usage
WHERE usage_date >= current_date() - INTERVAL 30 DAYS
  AND usage_metadata.job_id IS NOT NULL
  AND sku_name LIKE '%ALL_PURPOSE%'
GROUP BY ALL ORDER BY dbus DESC
Every row that returns is a job paying the interactive rate to run unattended. Look up the actual rate difference for your tier in system.billing.list_prices rather than trusting a number you read somewhere.
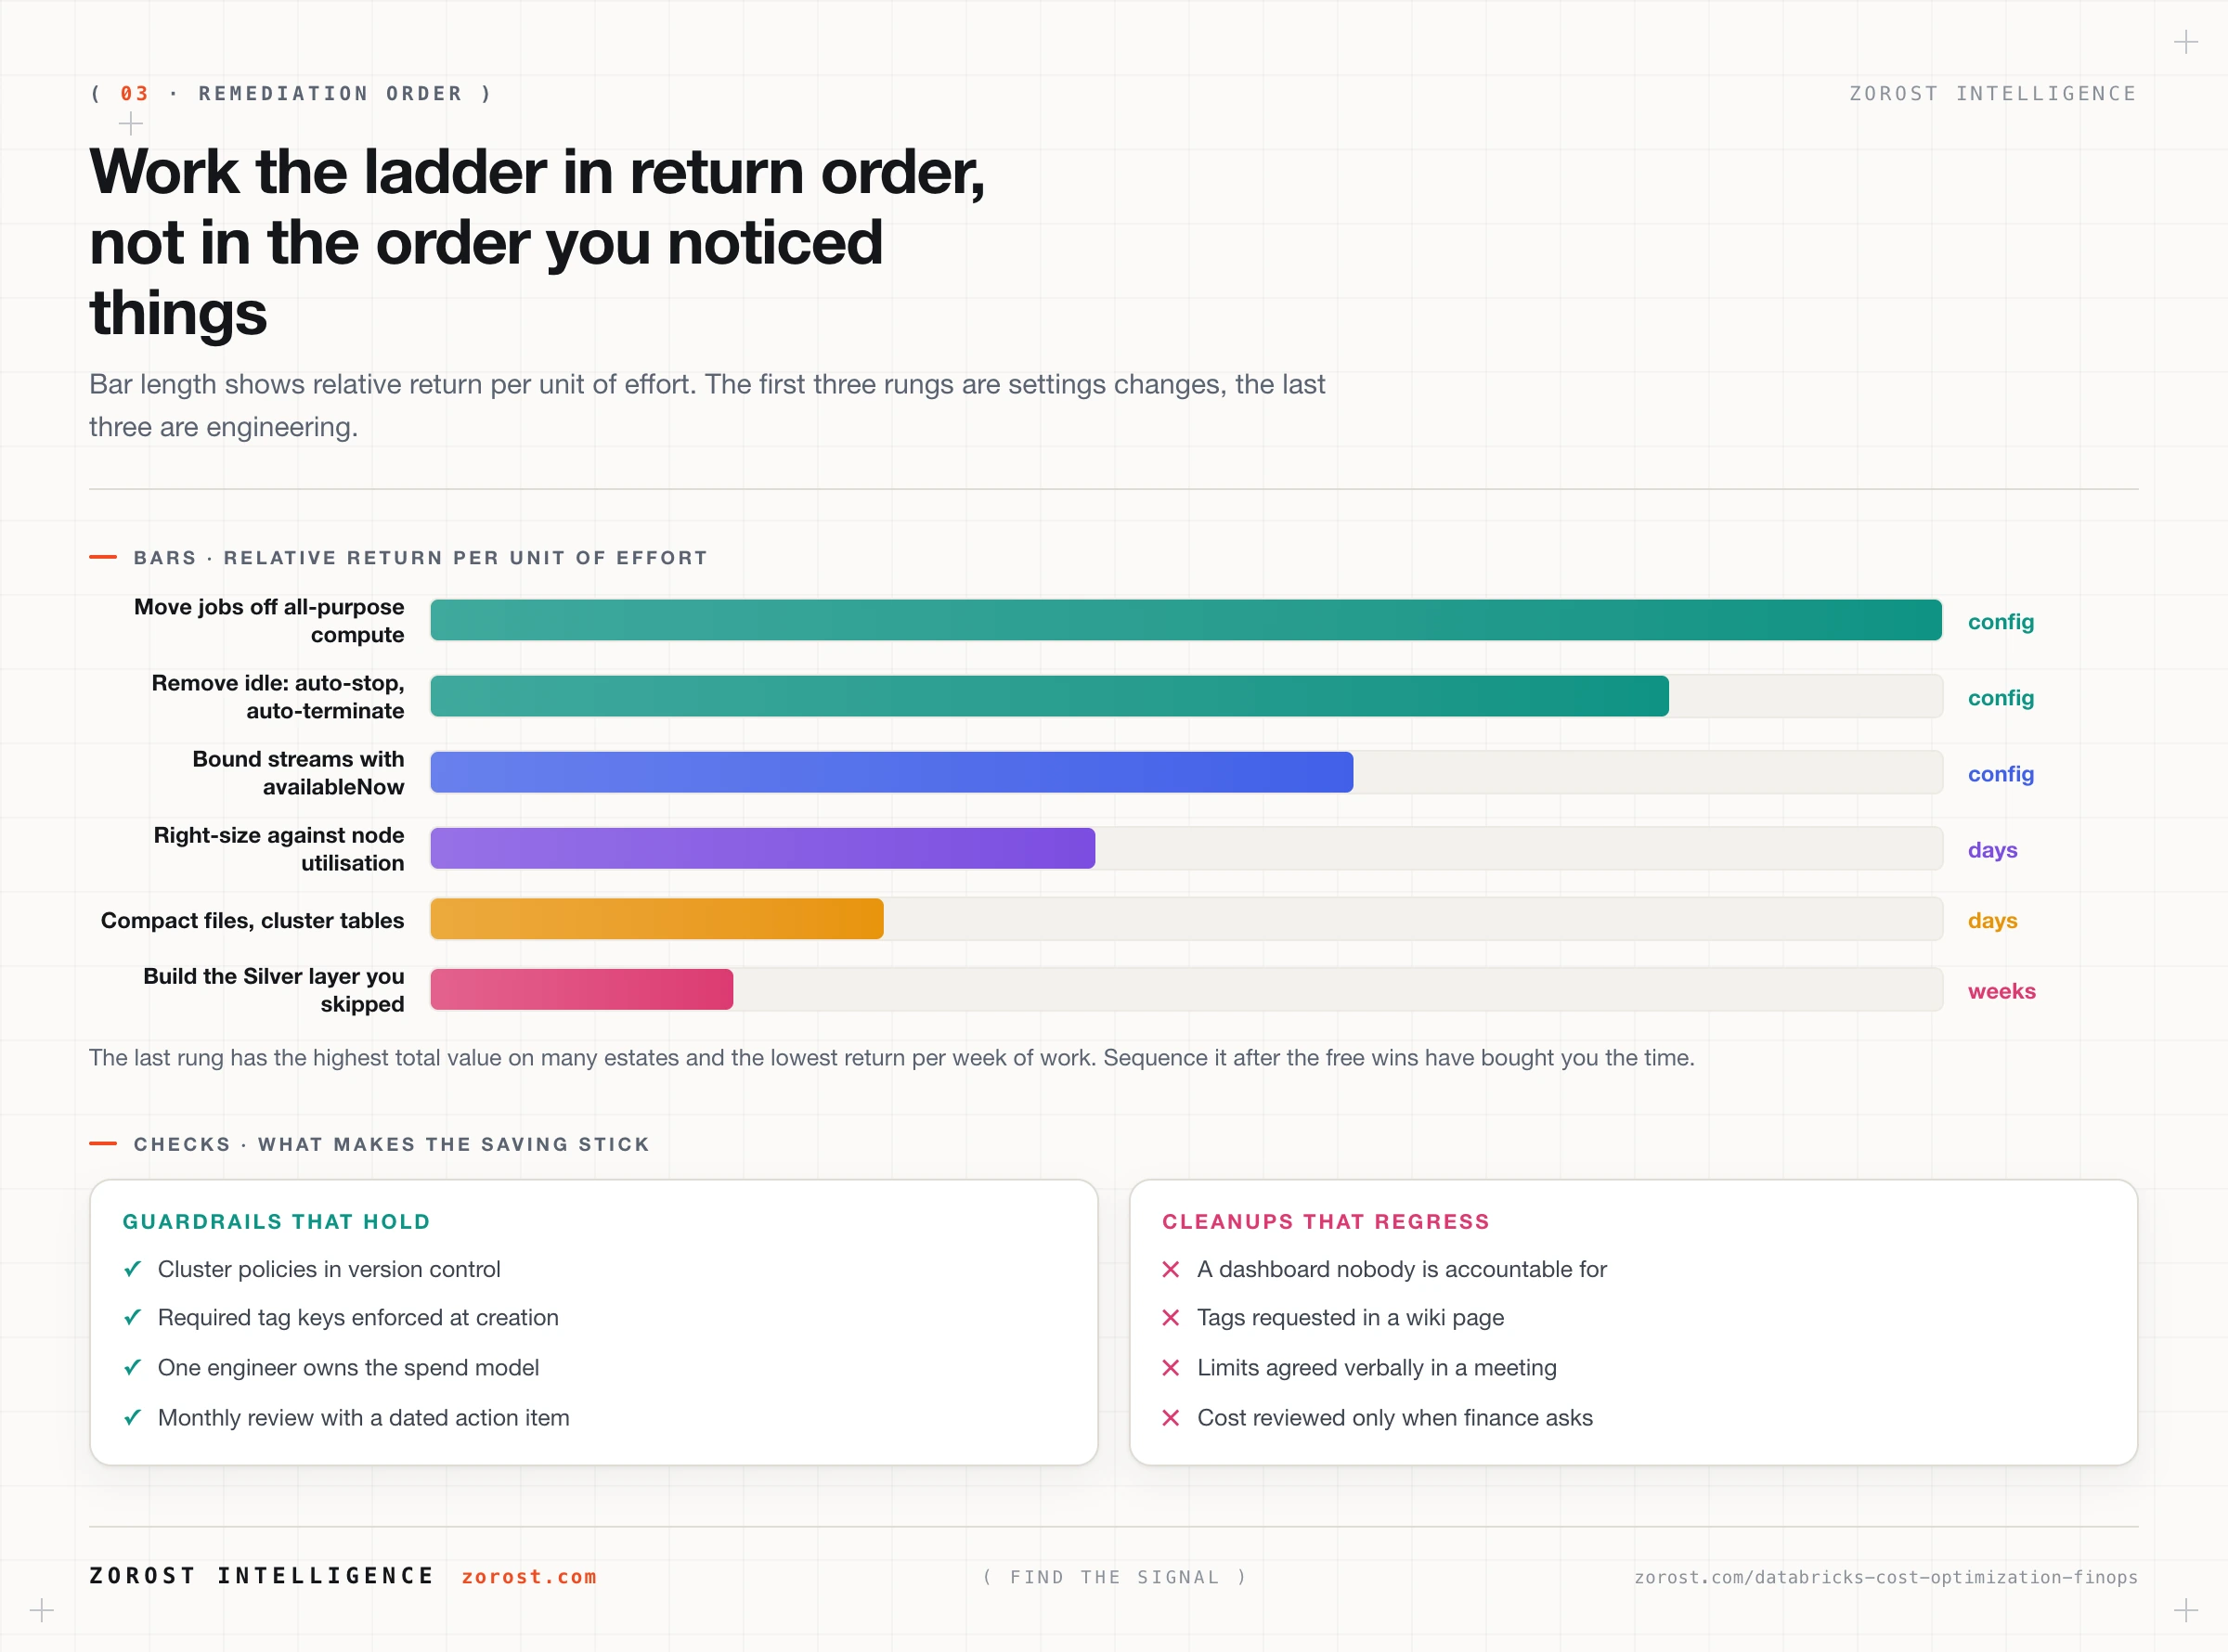
What is the right order to fix things in?
Fix in this order: mis-shaped compute, idle compute, always-on compute, right-sizing, data layout, then the missing layer. The ordering is by return per unit of effort, and the first three rungs need no code review.
- Move scheduled work off all-purpose compute. Jobs compute and serverless jobs are priced for unattended execution, and the workload cannot tell the difference.
- Remove idle. Set auto-stop on every warehouse and auto-termination on every cluster, then consolidate so one audience shares one warm warehouse instead of five half-warm ones.
- Bound anything unbounded. A structured streaming query with
.trigger(availableNow=True)processes everything available and exits, so cost follows data volume instead of the clock. - Right-size against evidence. Use
system.compute.node_timelineto find clusters whose utilisation never justified their size, and lower the autoscaling floor before touching the ceiling. A job that finishes while nodes are still joining wants a smaller fixed cluster. - Fix data layout. Compact small files, cluster tables so queries prune instead of scanning, and enable predictive optimization on Unity Catalog managed tables so maintenance runs unattended.
- Build the layer you skipped. When several Gold jobs each read raw Bronze and redo the same deduplication, typing, and conformance, you pay for that logic once per job and maintain it once per job. One Silver table ends both.
Should your workloads run on serverless or classic compute?
Serverless wins when a workload is spiky, short, or frequently idle, because you stop paying for the gaps. Classic wins when you need control over the machine or you can keep a right-sized cluster genuinely busy.
The decision test is a ratio you can measure: billable time divided by useful time. A warehouse awake eight hours to serve forty minutes of queries has a terrible ratio, and serverless fixes it by making start-up fast enough that idling is unnecessary. A cluster running a dense pipeline for six hours already has a good ratio, so serverless buys less there. What you give up is the machine: no choice of instance family, and workloads needing specific hardware, custom images, or unsupported languages stay classic. Serverless limits move as the product moves, so check current documentation before committing a migration.
Photon is the same shape of decision. Photon is Databricks’ vectorised query engine, and enabling it raises the DBU rate per hour while lowering runtime. It wins when the speedup exceeds the rate increase, common on scan-heavy SQL and Delta writes, and loses when work is dominated by Python user-defined functions or many tiny tasks. Because it is a toggle, run the job twice and compare DBUs consumed, not wall clock.
What guardrails keep the savings from coming back?
Guardrails are mechanisms that make the expensive choice unavailable, plus a named owner and a fixed review cadence. Cost work without them is a cleanup, and cleanups regress.
Cluster policies are the enforcement layer. A policy can cap autotermination_minutes, constrain node types to a sanctioned list, limit dbus_per_hour, and require tag keys so an untagged cluster cannot be created at all. Policies act at creation time, which is exactly where tagging has to happen, so the two problems solve each other. Keep policy definitions in version control, because a policy edited in a UI by an unknown person on an unknown date is not a control.
Budget alerts cover what a policy cannot: gradual growth inside sanctioned limits. Set a threshold that emails somebody with authority to act, not a shared mailbox.
Then the organisational half, which decides whether any of this lasts. Name one engineer accountable for the spend model, not a committee. Set a cadence, monthly is usually enough, and run the same three queries: spend by team, top jobs by DBU, warehouse hours with no statements. Each review produces one action item with an owner and a date. That is what separates FinOps as engineering from FinOps as reporting: policies are code, the cost model is a table, and an unexplained increase gets triaged like a bug.
Where this goes wrong
Turning things off before measuring. The symptom is a cost push that saves real money for six weeks then rebounds past where it started. No change was tied to a driver, so nobody could tell which one mattered and none were defensible. Attribution first, even when the waste looks obvious.
Tagging after the fact. The symptom is a chargeback report where a large slice of spend is unattributed and stays that way however many tags you add. Tags apply at creation and are never backfilled onto historical usage. Enforce through policy going forward, and say plainly that the past is partially unknowable.
Publishing list price as the invoice. The symptom is finance rejecting the engineering number, after which both sides keep separate spreadsheets. Classic compute infrastructure sits in the cloud bill, entirely outside the DBU model.
Optimising queries when the problem is idle time. The symptom is weeks of genuine tuning work against a flat bill. The money was in hours where nothing ran, and no query improvement reduces the cost of a warehouse that is awake and unused.
Autoscaling used as a substitute for sizing. The symptom is clusters that scale up and never back down, and short jobs finishing while nodes are still joining. Pin small jobs to a fixed small cluster and reserve autoscaling for genuinely variable volume.
Common questions
What exactly is a DBU?
A DBU, or Databricks Unit, is a normalised unit of processing capacity that Databricks bills per hour of consumption. The rate depends on the product, such as all-purpose compute, jobs compute, or SQL, and on your account tier. On classic compute you also pay your cloud provider separately for the machines underneath; on serverless that cost is folded into the DBU rate.
Is serverless always cheaper than classic compute?
No. Serverless is cheaper when idle time dominates, because you stop paying between bursts, and it can cost more when you could keep a right-sized classic cluster busy for hours. Compare billable time against useful time per workload rather than setting a platform-wide rule.
Can I attribute spend by team without tags?
Partially. The usage_metadata struct identifies the job, cluster, warehouse, and pipeline behind each usage row, and system.compute.clusters records the owner. Tags are what keep attribution stable when resources are renamed, shared, or recreated by automation.
How far back does system table history go?
Retention is finite and differs per table, so check the documented retention for the tables you depend on. If you need multi-year trend, snapshot a daily aggregate into your own Delta table starting now, because history cannot be recovered after it ages out.
Next steps
Run both queries against your own metastore before changing a single setting. The list of jobs paying the interactive rate is usually short and immediately actionable, and it earns you the credibility to ask for time to do the harder work further down the ladder.
Then read data architecture is a fit decision, because the most expensive driver on the list is an architecture problem, and choosing a pattern by reputation is how a missing Silver layer happens. If the platform is meant to answer questions in natural language, Genie and answers you can defend covers what the curated layer needs first. More writing sits in the Signals index.
Cost instrumentation ships with the platform in Zorost lakehouse delivery as a trusted Databricks partner, where the tagging scheme, the cluster policies, and the spend queries are handed over with the pipelines rather than written after the first surprising invoice.