
Lakebase and the operational database an agent needs
Pull-quote: “Primary key and unique constraints on a Delta table are informational. Your agent’s idempotency guarantee is a comment until something enforces it.”
An agent needs a transactional database for the state it writes during a run, and an analytical table is the wrong shape for that work. A Delta table answers “what happened across forty million rows last quarter” with transactions at file granularity. An agent asks “does an approval row for this action already exist, and can I claim it before the other worker does”, several times a minute, and needs a point read with a uniqueness guarantee behind it.
This post is for data and platform engineers who already run a lakehouse and are now putting agents on top of it. It uses Databricks Lakebase as the concrete case, but the argument is about the split rather than the product: if you run agents against Snowflake, BigQuery, or a plain object store, the same six kinds of state still need somewhere transactional to live. By the end you will be able to place each of them, describe Lakebase accurately, and recognise the case where a second store buys you nothing.
What you will be able to do
- List the six kinds of state an agent writes during a run and match each to the store that fits it.
- Explain, in terms of concurrency and enforced constraints, why a Delta table cannot hold agent state safely.
- Define Lakebase precisely and state where it is generally available today.
- Move data both directions between Postgres and Unity Catalog without maintaining a pipeline.
- Write the four SQL patterns that make an agent loop safe to retry and to resume.
- Recognise the case where you do not need a separate operational store.
What state does an agent actually write during a run?
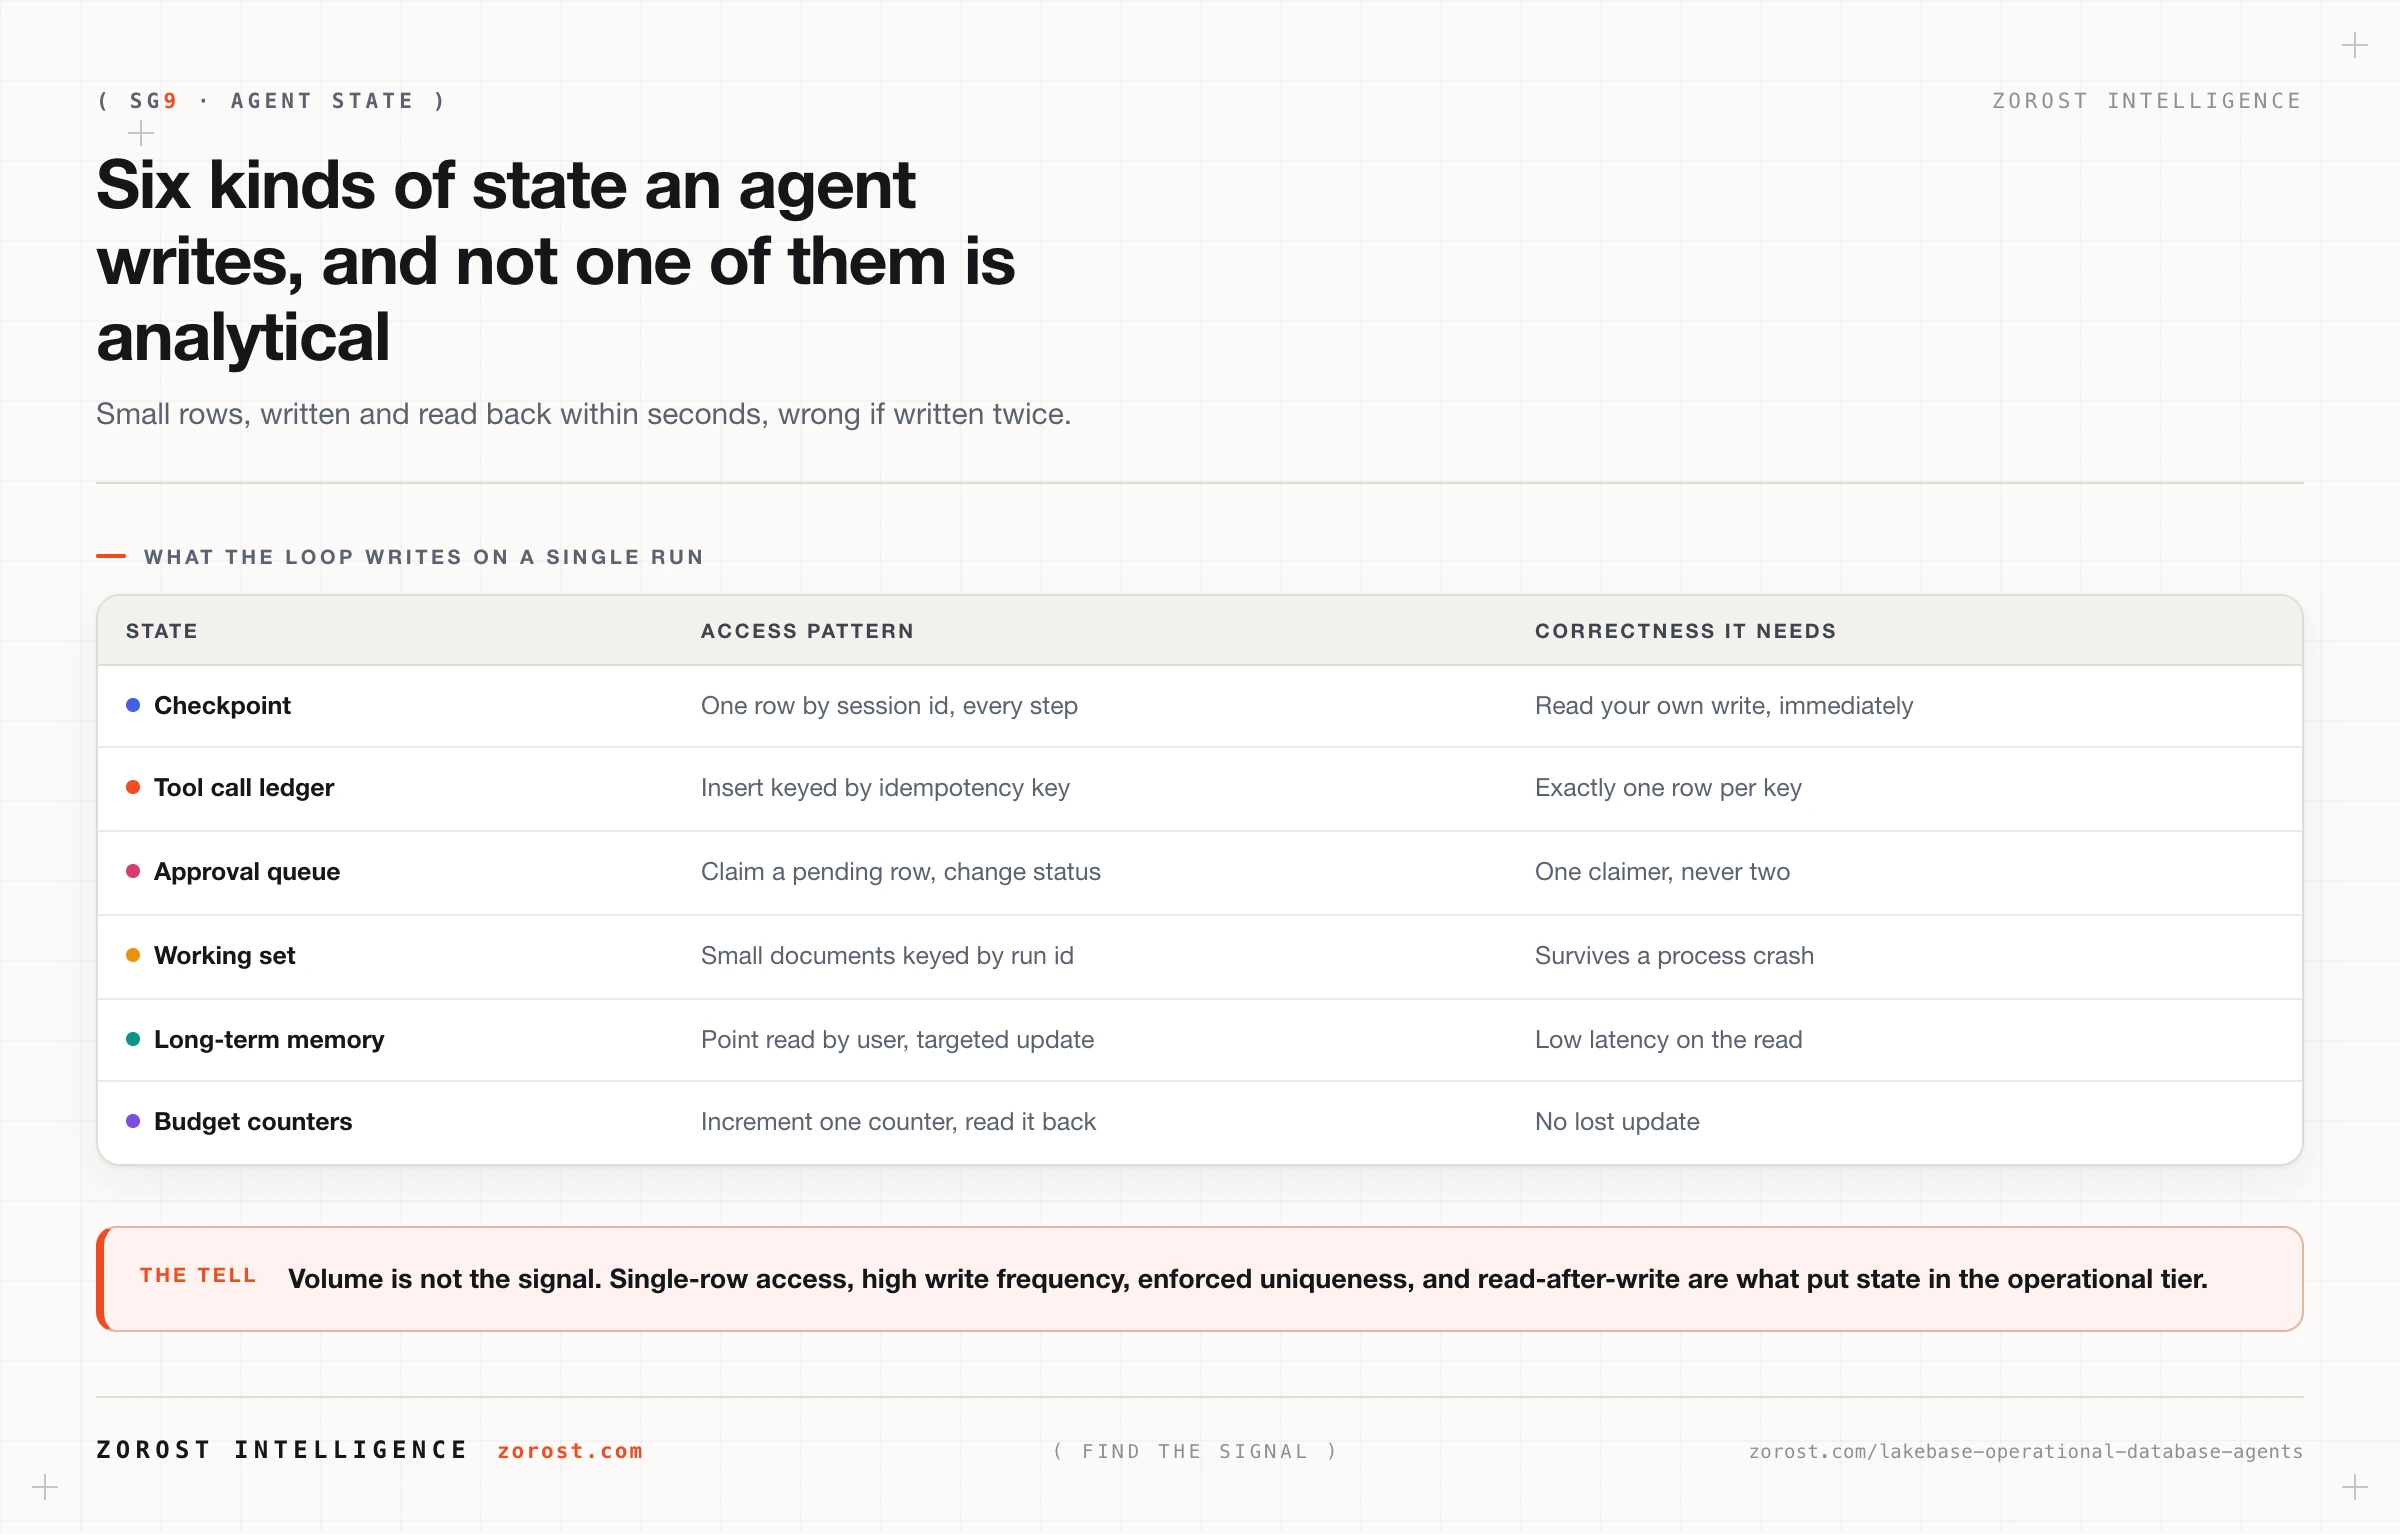
An agent writes six kinds of state during a run, and none is analytical. Each is small, each is read back within seconds by the process that wrote it, and most are wrong if written twice.
| State | Written when | Access pattern | Correctness it needs |
|---|---|---|---|
| Checkpoint | Every step | Read and write one row by session id | Read your own write, immediately |
| Tool call ledger | Every tool call | Insert keyed by idempotency key | Exactly one row per key |
| Approval queue | Before any write tool | Claim a pending row, change its status | One claimer, never two |
| Working set | During planning | Small documents keyed by run id | Survives a process crash |
| Long-term memory | End of a run | Point read by user, targeted update | Low latency on the read |
| Budget counters | Every step | Increment one counter and read it back | No lost update |
What makes this operational is not volume. A busy agent fleet might write a few gigabytes a month, which is nothing. It is the shape: single-row access, high write frequency, strict uniqueness, and a read immediately after a write returning the new value. Those four properties are exactly what a columnar analytical table trades away in exchange for scan throughput.
Why is a Delta table the wrong place for agent state?
Because Delta gives you transactions over files rather than rows, and on Databricks it does not enforce uniqueness at all. Both are correct decisions for analytics and disqualifying for agent state.
Start with uniqueness, the point teams discover late. Databricks enforces exactly two constraint types on a Delta table: NOT NULL and CHECK. Primary key, foreign key, and unique constraints are informational, declared for query optimisation and documentation, and not enforced by the engine (Databricks constraints documentation). A ledger table with CONSTRAINT ledger_pk PRIMARY KEY (idempotency_key) will accept the same key twice, and under a retry storm the duplicates arrive at the moment the guarantee matters most.
Concurrency is the second problem. Delta provides ACID guarantees through optimistic concurrency: writers work against a consistent snapshot and commits are ordered serially, so when two commits touch overlapping files, one wins and the other retries its whole transaction (isolation levels and write conflicts). Sound for a handful of batch jobs, poor for twenty agent workers each changing one row, because the retry unit is the commit rather than the row.
Two smaller problems finish the case. Every small write produces new data files plus a transaction log entry, so a chatty agent converts itself into a compaction backlog. And a Delta read is a query plan over files rather than an index seek, so “fetch the checkpoint for session 8817” varies more than an interactive path can tolerate. None of this makes Delta the wrong technology. It makes it the wrong tier, and the right one for the trajectories after the run.
What is Lakebase, and can you use it today?
Lakebase is a fully managed, serverless Postgres service built into the Databricks platform, with compute separated from storage, autoscaling, scale to zero when idle, copy-on-write branching, point-in-time restore, and Unity Catalog integration (Lakebase Postgres documentation). It is real Postgres, so you connect with psql or any standard driver and your ORM does not care.
State availability precisely, because the answer changed twice in six months. Databricks announced general availability on AWS on 3 February 2026, with Azure in beta at that point. Azure Databricks Lakebase reached general availability in March 2026 across fourteen regions, with Google Cloud stated as planned rather than shipped. The GA release runs Postgres 17, still supports 16, and supports community extensions including pgvector.
One version detail matters when reading older material. Since 12 March 2026, new instances are created as Lakebase Autoscaling projects rather than the original provisioned instances, and existing provisioned instances are being upgraded automatically, so anything written before that date describes capacity units you no longer size by hand. The restore window is configurable from 2 to 35 days and defaults to 7.
Being real Postgres also means inheriting the Postgres connection model. An agent that opens a connection per step exhausts connections long before it exhausts the database, so pool at the client. This is the most common first outage on the pattern, and it presents as an availability problem rather than a configuration one.
How do the two stores stay in step without a pipeline you maintain?
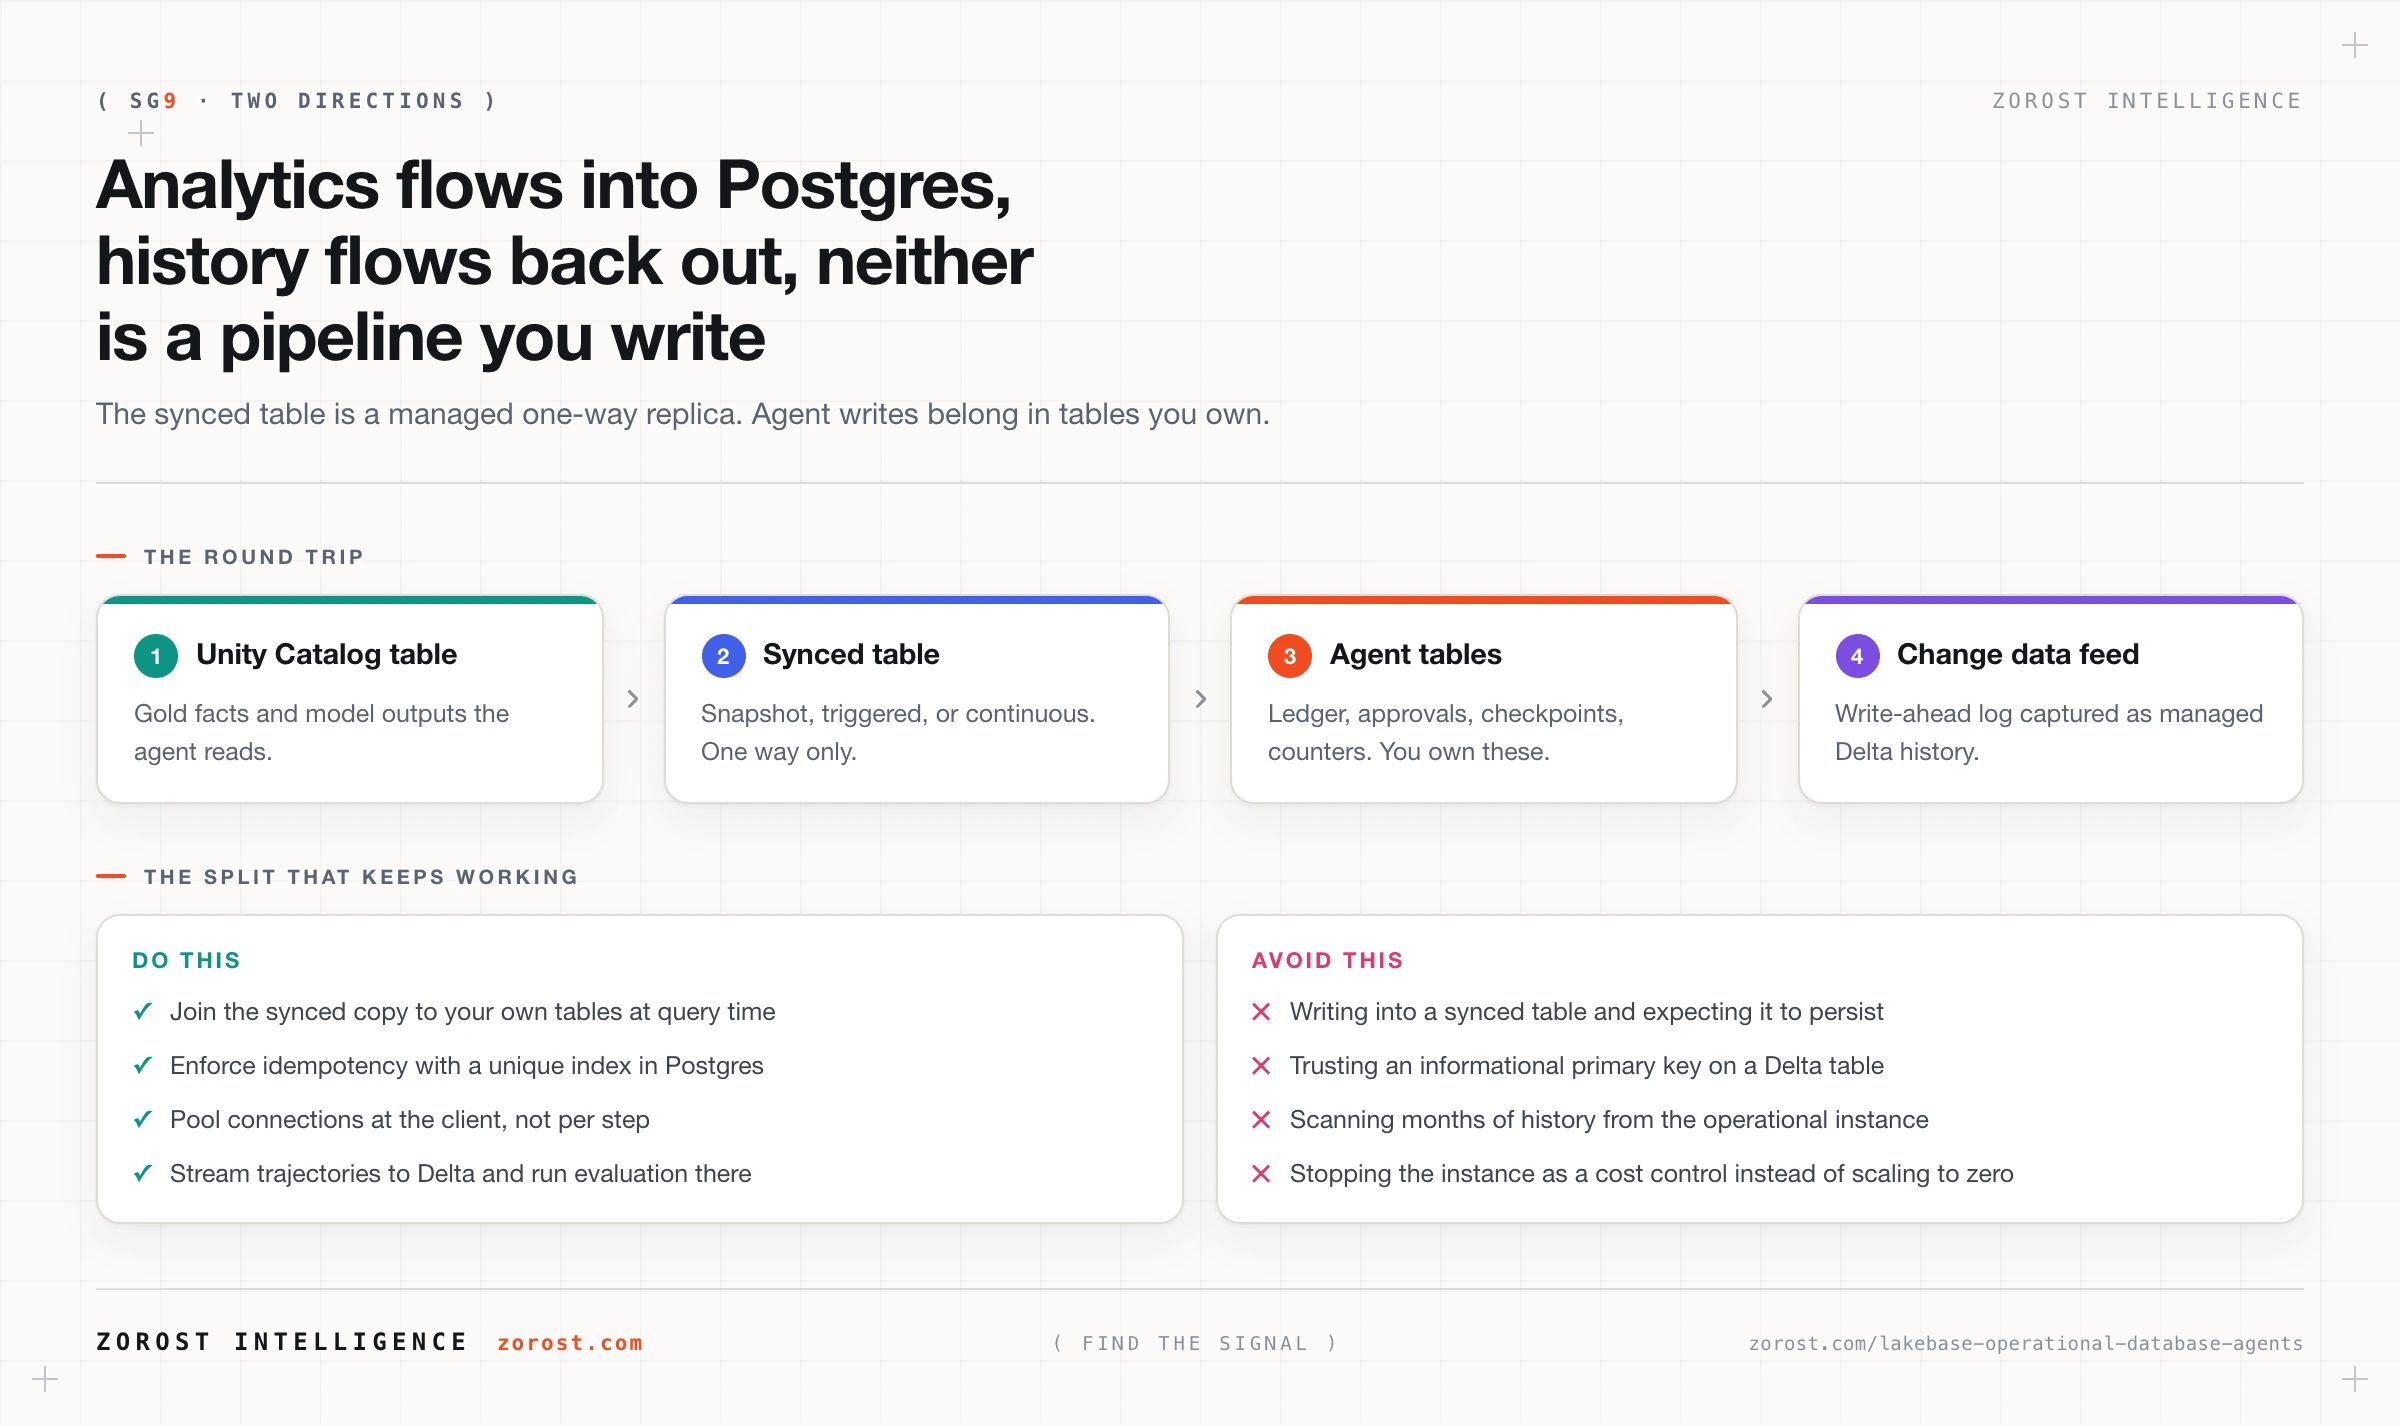
Two managed paths move data in each direction, and neither is a pipeline you write. That is what changes the economics, because the old version of this architecture meant an external database, network plumbing, a change-data-capture tool, and a second permission model.
Inbound, synced tables bring a Unity Catalog table into Postgres for low-latency reads, in snapshot, triggered, or continuous mode. Databricks calls this reverse ETL, and the property that matters is that it runs one way. A synced table is a managed replica, so your agent’s own writes belong in separate tables you own. Writing into a synced table is the fastest way to lose data on this architecture.
Outbound, Lakebase Change Data Feed captures every insert, update, and delete from the Postgres write-ahead log and lands them as Unity Catalog managed Delta tables, on independent compute so capture does not compete with production queries. The history table has the same shape as Delta Change Data Feed, so downstream pipelines treat it like any other Delta source. It is in Public Preview as of this writing, which is the right time to design for it and the wrong time to hang a compliance obligation on it.
Which state goes in which store?
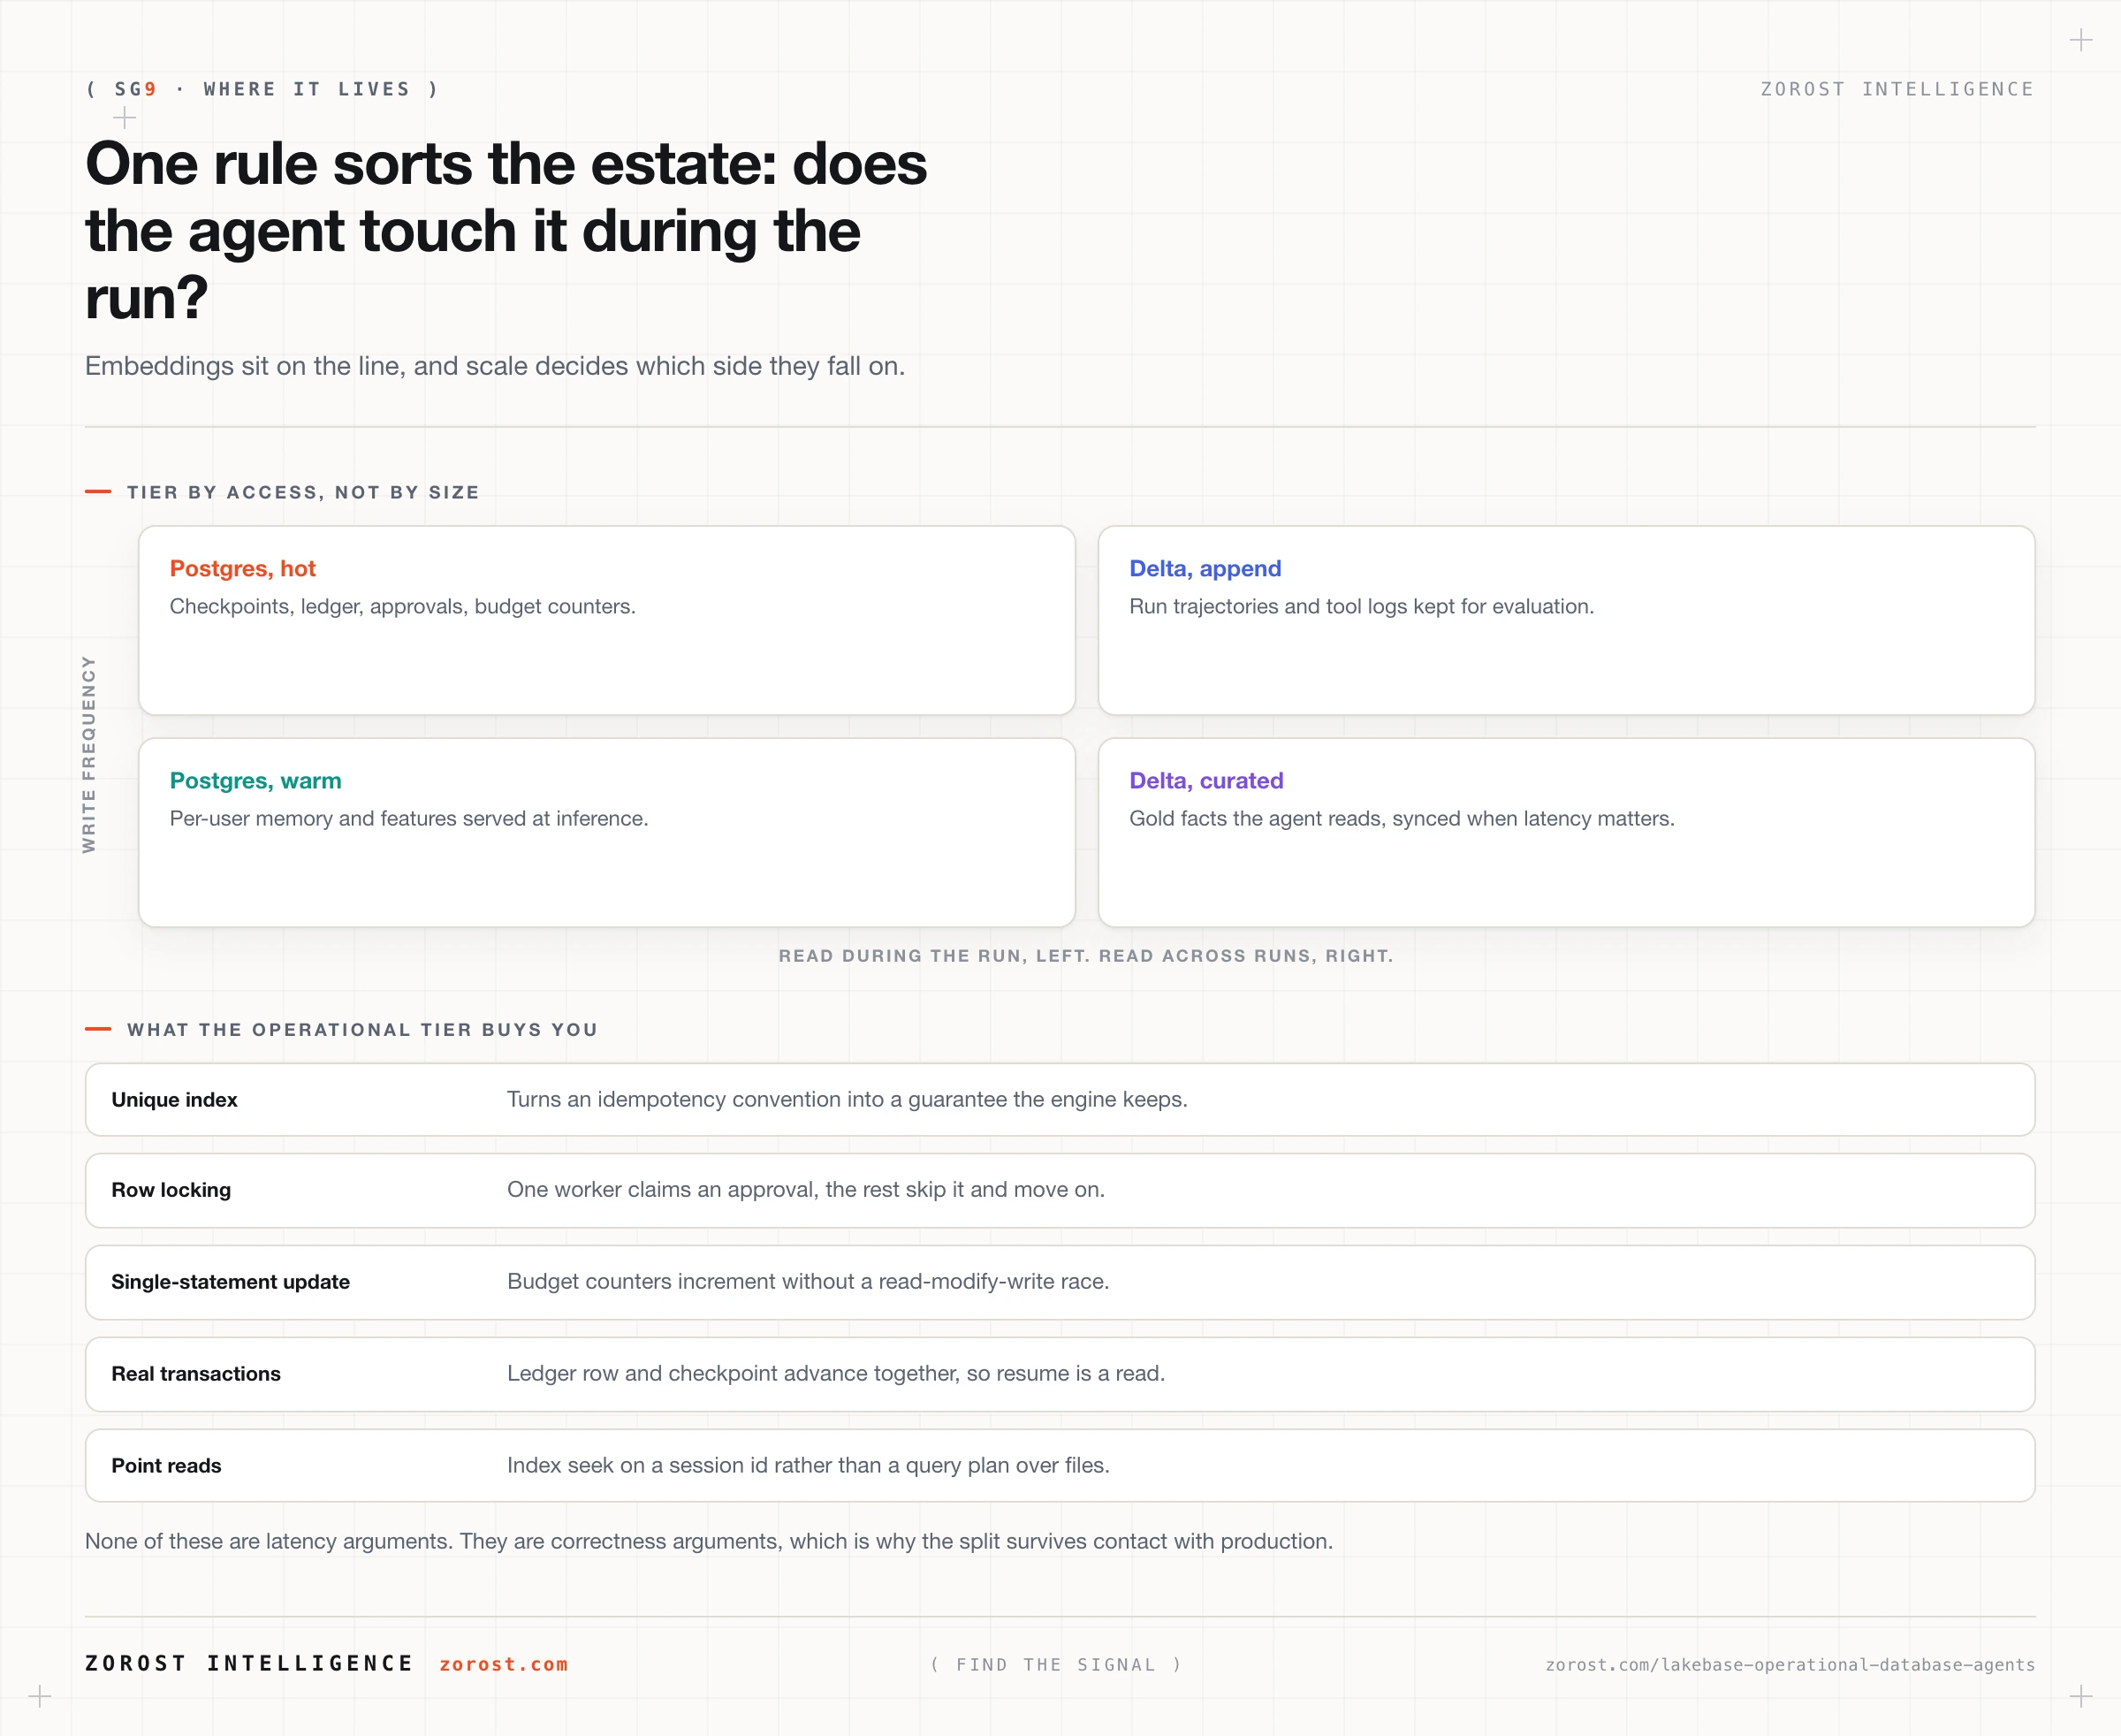
One rule sorts almost every case: if the agent reads or writes it during a run, it is operational, and if you read it across runs to learn something, it is analytical. Apply it mechanically and most of the arguments disappear.
Checkpoints, ledger rows, approval records, working sets, per-user memory, and budget counters are operational. Feature values served to a model at inference time are operational too, which is why Databricks Online Feature Stores are themselves powered by Lakebase Autoscaling. A year of run trajectories is analytical. Gold tables your agent reads business facts from are analytical, and become operational copies only through a synced table when the read sits on a latency-sensitive path.
Embeddings sit on the boundary, and scale decides. A per-user memory index of a few thousand rows is comfortable in pgvector beside the rest of the agent’s state, which saves a network hop and a second consistency model. A corpus-scale index over millions of documents belongs in a purpose-built vector index.
What changes in the loop when the state is transactional?
Four guarantees become enforceable in one statement each, instead of conventions your code hopes to uphold. That payoff is bigger than the latency argument usually made first.
-- 1. Idempotency, enforced by the index, not by convention.
CREATE UNIQUE INDEX ledger_key_uq ON tool_calls (idempotency_key);

INSERT INTO tool_calls (idempotency_key, tool, args, run_id)
VALUES ($1, $2, $3, $4)
ON CONFLICT (idempotency_key) DO NOTHING
RETURNING id;
-- No row returned means this call already ran. Do not repeat it.

-- 2. Approval claiming, safe for a pool of workers.
UPDATE approvals
   SET status = 'claimed', claimed_by = $1, claimed_at = now()
 WHERE id = (SELECT id FROM approvals
              WHERE status = 'pending'
              ORDER BY created_at
              FOR UPDATE SKIP LOCKED
              LIMIT 1)
RETURNING id, action, payload;

-- 3. Budget counters with no read-modify-write race.
UPDATE run_budget
   SET tokens_spent = tokens_spent + $2
 WHERE run_id = $1
RETURNING tokens_spent, tokens_limit;

-- 4. Checkpoint and ledger written in one transaction, so resume is a read.
BEGIN;
  INSERT INTO tool_calls (...) VALUES (...);
  UPDATE checkpoints SET step = step + 1, state = $1 WHERE session_id = $2;
COMMIT;
Pattern one is wired correctly when a deliberately duplicated call returns no row from RETURNING and your loop logs a replay rather than a second side effect. You can test that today against a local Postgres, before any of it touches Databricks.
Pattern four changes how crash recovery feels. When the ledger row and the checkpoint advance in one transaction, a process that dies mid-step leaves the database either fully before or fully after that step. Resuming becomes a read rather than a reconciliation, and the compensating logic that works out what half-happened stops being necessary.
When do you not need a separate operational store?
When you have one user, one process, short runs, no approval gates, and no concurrent writers. A single-user research agent writing Markdown files to disk has none of the problems above, and a managed database adds operational cost with no return. Be honest about which system you are building before buying machinery for the other one.
A second case gets less attention. If you already operate Postgres and your agent does not need to sit beside lakehouse data, Lakebase offers governance unification and managed sync rather than a capability you lack. That can be the right trade, but it is a different argument from “we need OLTP” and should be made on its own terms.
Where this goes wrong
Writing into a synced table. The symptom is an update that vanishes at the next sync. The cause is treating a one-way replica as a read-write table. Keep agent writes in tables you own and join to the synced copy at query time.
Trusting an informational primary key. The symptom is duplicate ledger rows after a burst of retries, usually during an incident. The cause is a PRIMARY KEY declared on a Delta table, which Databricks does not enforce. Enforce it with a unique index in Postgres, or deduplicate on read.
Scale to zero on an interactive path. The symptom is a slow first message after a quiet period. The cause is compute suspending as designed and reactivating on the next query. Accept the reactivation cost, which the documentation puts in the hundreds of milliseconds, or keep a warm path for user-facing traffic.
A connection per step. The symptom is connection errors under load rather than slow queries, which sends people to read query plans for an afternoon. The cause is no client-side pooling. Pool, and monitor open connections rather than only CPU.
Analytics left in Postgres. The symptom is an evaluation query over months of trajectories degrading live agent traffic. The cause is a trajectory table that never moved. Stream it to Delta and analyse it there.
A stopped instance used as a cost control. The symptom is synced tables no longer serving reads. Scale to zero is the cost control, and stopping is a maintenance action.
Common questions
Is Lakebase just Postgres?
Yes, in the sense that matters to your application: it speaks the Postgres wire protocol, runs Postgres 17 with continued support for 16, and works with standard drivers and extensions such as pgvector. What differs is underneath, where separating compute from storage gives autoscaling, scale to zero, branching, and point-in-time restore.
Do I need Lakebase to build an agent on Databricks?
No. You need somewhere transactional for the state the agent writes, and any managed Postgres will hold it. Lakebase earns its place when you want that store governed by the same Unity Catalog permissions as the lakehouse and synced both directions without a pipeline you maintain.
Where should conversation history live?
The active session’s checkpoint belongs in Postgres, because the loop reads it back on every step and needs the write it just made. The completed transcript belongs in Delta, because you will scan thousands of them for evaluation and never fetch one by primary key on a latency budget.
Can I query agent state from a SQL warehouse?
Yes, by two routes. Register the database instance in Unity Catalog and query it as a catalog for live operational rows, or let change data feed land the history as managed Delta tables. Use the first for a support question about one run and the second for anything that scans.
Does Databricks run its own agents on this pattern?
The public detail is thin, so treat any specific claim carefully. Databricks announced Lakewatch, an agentic security information and event management product, on 24 March 2026, in private preview at that announcement. Whether it uses Lakebase for its own operational state is not documented publicly.
Next steps
Take one agent you already run and write down its six kinds of state on a single page, marking which store each currently lives in. Most teams find at least two pieces in the wrong tier, and the ledger is usually one of them.
Then read agent memory architecture for what belongs in semantic, procedural, and episodic memory and why the retrieval path differs for each. Choosing data architecture patterns by fit works through the same decision at estate scale, and where Databricks spend actually goes explains which line items move when you add a serverless tier.
Zorost builds these splits on client lakehouses as a trusted Databricks partner, where the approval queue is a real table with a unique index rather than a state machine in the prompt, because an agent that can execute the same write twice is not ready for a system of record.