
Six Layers of an Analytical Operations Center, Explained
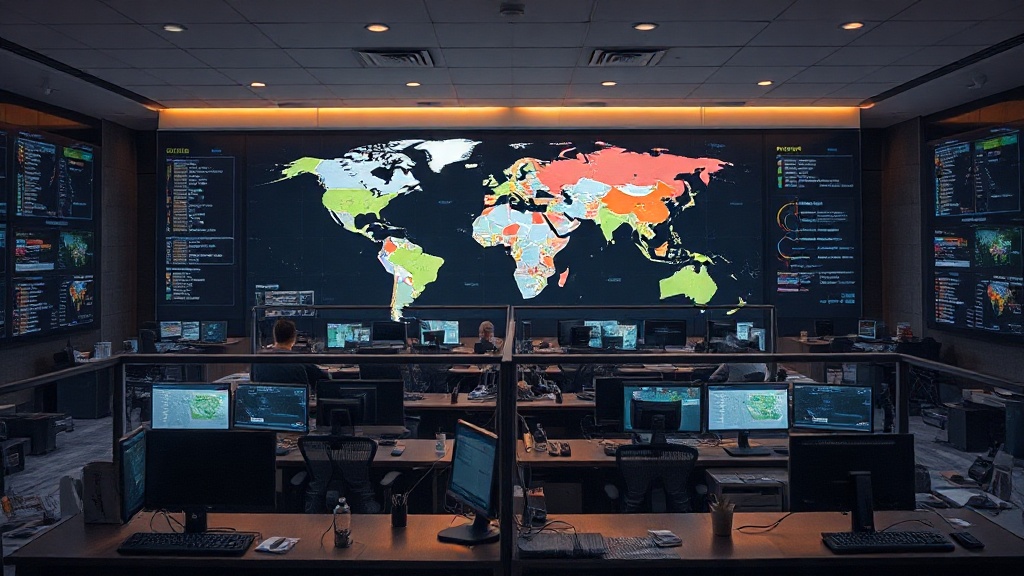
Pull-quote: “Every seam between two analyst tools is a place where provenance dies and an hour disappears. The analytical chain is one chain. The tooling should be too.”
Why this matters
Watch an analyst cover a fast-moving situation and count the windows: a feed aggregator, a mapping tool, a spreadsheet of actors, a forecasting site, a chat model with no access to any of it, and a slide deck where the conclusions go to lose their sources. Decision-makers routinely work across five to ten fragmented tools before they can act. The cost is not just time. Every seam between tools drops provenance, resets context, and hides the relationship between what was observed and what was concluded. The analytical chain runs from raw signal to recommended action, and it is one chain. An operations center built as six layers in one environment respects that fact, because fragmenting the chain across tools fragments the reasoning itself.
The six layers
 6  DECISION SUPPORT   recommended courses of action, reasoning attached
 5  SIMULATION         scenario simulation, game-theoretic modeling
 4  PREDICTION         forecasts beside prediction-market signals
 3  ANALYSIS           AI analyst grounded in live data, with citations
 2  KNOWLEDGE GRAPH    actors and connections, resolved and queryable
 1  MONITORING         live open-source signals on map and panels
───────────────── each layer consumes the layers below it| Layer | Question it answers | What it produces |
|---|---|---|
| Monitoring | What is happening right now? | Live events on 2D, 3D globe, and satellite map views, with real-time panels |
| Knowledge graph | Who is involved, and how are they connected? | Resolved actors and relationships, queryable |
| Analysis | What does it mean? | Grounded answers with citations, tools on tap |
| Prediction | What might happen next? | Forecasts next to live prediction-market signals |
| Simulation | How could it evolve under different choices? | Scenario runs and game-theoretic structure |
| Decision support | What should we do? | Recommended courses of action with reasoning |
Why the stacking matters
The order is not cosmetic. Each layer is only as good as the one beneath it, and each exists to answer a question the layer below cannot. Monitoring without a knowledge graph shows events but not the actors recurring across them. A knowledge graph without grounded analysis is a diagram nobody interrogates. Analysis without prediction stops at the present tense. Prediction without simulation gives probabilities but no way to rehearse responses. And everything below decision support is homework until it becomes a recommended course of action with the reasoning attached.
Most tooling covers one or two layers well and stops, which is exactly why the analyst has ten windows open. The integration is the product: a signal seen on the map can be traced to the actors it involves, asked about with citations, weighed against forecasts, played forward in simulation, and turned into a recommendation, without leaving the environment or losing the thread that connects the conclusion back to the observation.
The discipline the architecture enforces
A layered architecture is also a provenance policy. When the layers share one platform, the chain from raw signal to recommendation stays inspectable: which events fed the graph, which graph entities the analysis cited, which analysis the simulation assumed, which simulation the recommendation weighed. That chain is what a decision-maker’s trust should rest on, and it is precisely what dies in the seams when the chain is stitched across disconnected tools and pasted screenshots.
Closing
An analytical operations center is not a dashboard with ambitions. It is a chain of six questions, each feeding the next: what is happening, who is involved, what it means, what might happen, how it could evolve, what to do. Build the layers separately and the seams eat the provenance. Build them as one system and the answer at the top can always show its work all the way down to the signal that started it.